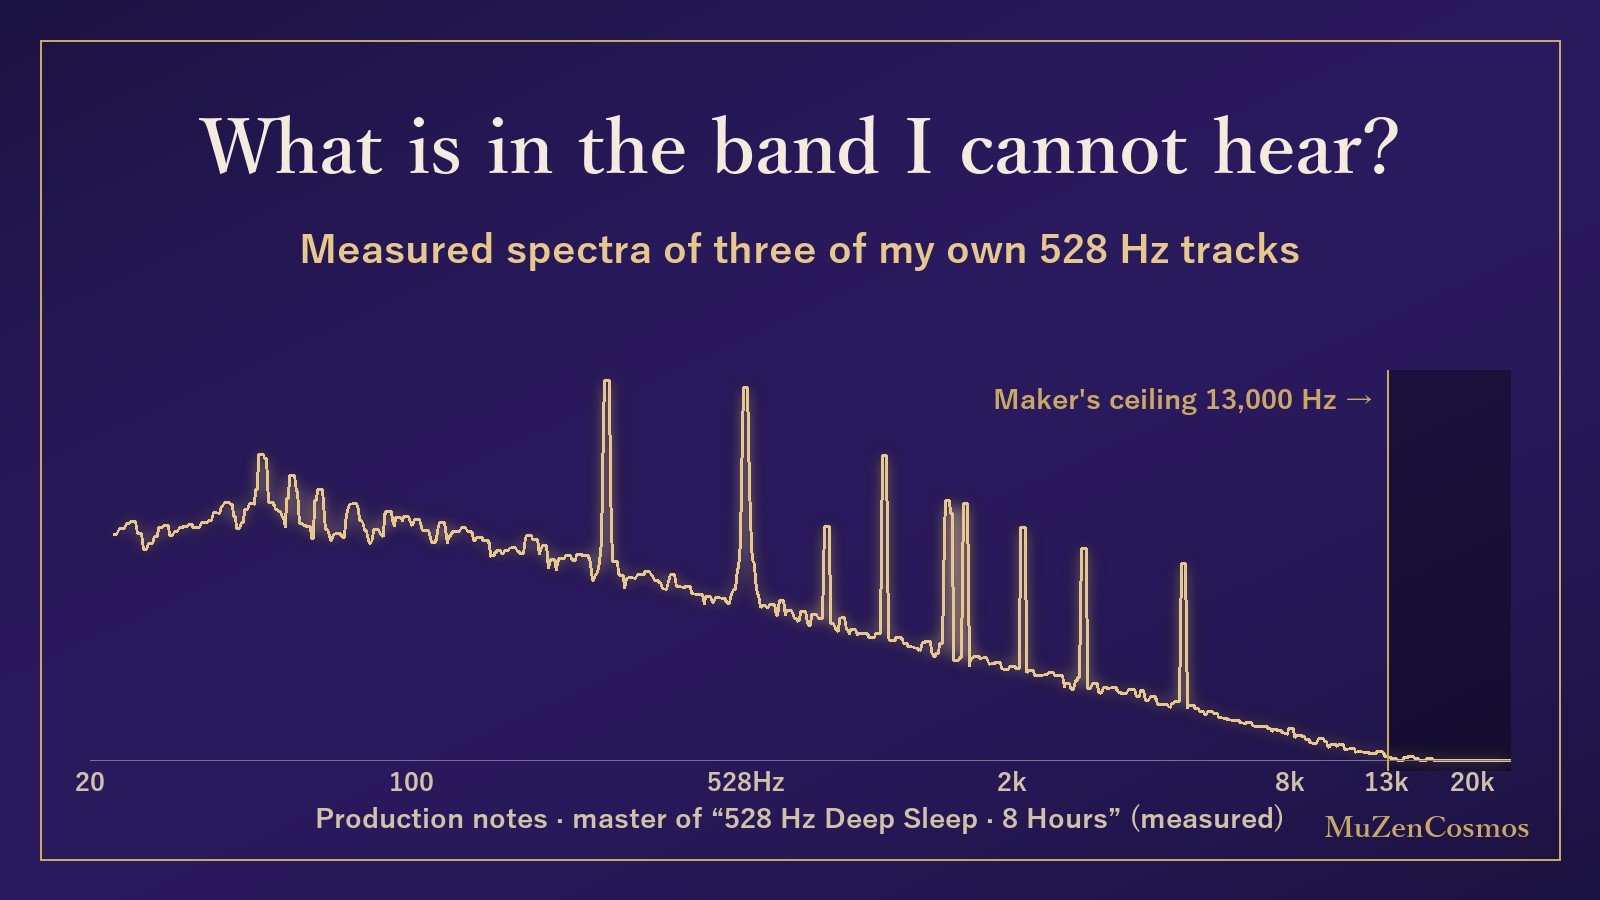
In the previous production note I found that my own hearing tops out at 13,000 Hz on wired earphones, and I wrote that I would check the bands I cannot hear by measurement rather than by ear. This is that measurement. The subjects are the master files (48 kHz WAV, before upload to YouTube) of three of my published 528 Hz tracks.
- 528 Hz Pure 3 Hours (published 2026-06-09)
- 528 Hz Deep Sleep 8 Hours (published 2026-08-06; the audio behind the 8-hour loop design note)
- Voices of Autumn Insects · 528 Hz · 1 Hour (published 2026-09-12)
Method
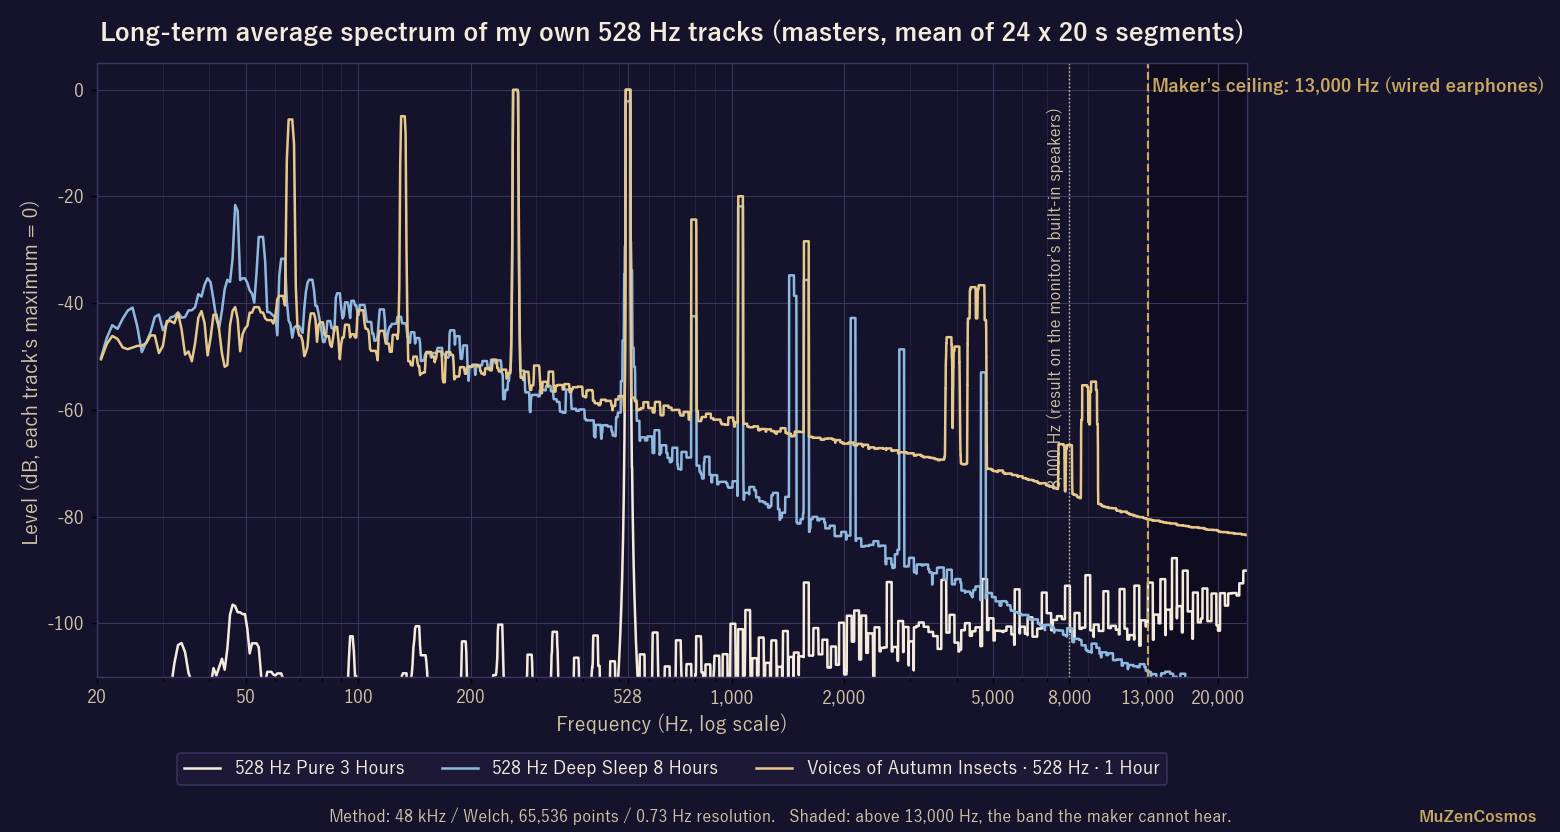
From each track I took 24 segments of 20 s at equal intervals (so an 8-hour file is sampled evenly across its whole length), computed the spectrum of the left and right channels and averaged them. Welch’s method, 65,536 points, 0.73 Hz resolution. Tools: ffmpeg and Python (NumPy/SciPy). Loudness was measured over the full length with ffmpeg’s ebur128. The same procedure for all three.
Results
| Pure 3 h | Deep Sleep 8 h | Insects 1 h | |
|---|---|---|---|
| Measured fundamental (528 Hz) | 527.99 Hz | 528.00 Hz | 528.00 Hz |
| Strongest component (energy within ±3 Hz) | 528 Hz | 264 Hz (+3.3 dB vs. 528 Hz) | 264 Hz (+1.0 dB vs. 528 Hz) |
| Share above 2,000 Hz | under 0.00001% | 0.0045% | 0.26% |
| Share above 8,000 Hz | under 0.00001% | under 0.00001% | 0.0081% |
| Share above 13,000 Hz | under 0.00001% | under 0.00001% | 0.0018% |
| Highest point above 13,000 Hz (vs. the track’s maximum) | −88 dB | −109 dB | −81 dB |
| Integrated loudness | -22.0 LUFS | -14.0 LUFS | -14.0 LUFS |
| Peak | -19.6 dBFS | -7.5 dBFS | -6.2 dBFS |
Shares are the fraction of the track’s total energy in that band. 10 dB is a factor of 10; 20 dB is a factor of 100.
1. “Pure” really is a pure tone
The 3-hour Pure track is a single sine wave at 527.99 Hz. The strongest harmonic is 92 dB below the fundamental (the second harmonic is 101 dB below), and everything above 2,000 Hz adds up to under 0.00001% of the energy. What remains is the 16-bit quantization noise floor, the amount you get even when “recording” silence.
2. The strongest component of “528 Hz Deep Sleep” is 264 Hz
The 8-hour sleep track layers 264 Hz, one octave below, under 528 Hz. Measured, 264 Hz is 3.3 dB stronger than 528 Hz; the 528 Hz in the title comes second (the second harmonic at 1,056 Hz is a further 20 dB down, and 132 Hz, two octaves below, is a small component 36 dB below 528 Hz). A track named “528 Hz” can deliver its strongest energy an octave lower. Above 2,000 Hz: 0.0045%. Above 8,000 Hz: under 0.00001%. The highest point above 13,000 Hz is 109 dB below the track’s maximum.
3. The insects in “Voices of Autumn Insects” are synthesized, not recorded
The insect sounds in this track are not a field recording; they were synthesized with amplitude modulation. The video description already says so (no field recordings or sample libraries), and I am restating it here. The synthesized insect component sits around 4,400–4,700 Hz, roughly 37 dB below the fundamental. Here too, by energy within ±3 Hz, 264 Hz sits level with 528 Hz (+1.0 dB). This is the only track of the three with a trace above 13,000 Hz (0.0018%), and that trace is not the insects but the tail of the pink-noise bed.
Conclusion: in these three tracks, the band I cannot hear is almost empty
Above 13,000 Hz, all three tracks are at least 81 dB below their maximum, and the largest share of energy up there is 0.0018%. Before the question of hearing it, nothing was put there. The reason is how they are made: these tracks are stacks of sine waves (plus a noise bed), not instrument recordings, so high bands that are not in the design do not appear.
My worry from the previous note, that I might be sending listeners sound I could not hear, turned out to be unfounded for these three. Tracks that use recorded instruments or reverb are a different matter, and I will measure one of those separately.
What this measurement does not tell
- The sound after YouTube’s re-encoding. I measured the masters before upload. What reaches a listener has been re-compressed by YouTube, and that version was not measured here.
- Not the full length. The spectra are averages of 24 x 20 s per track (about 1.7% of the 8-hour file). Only the loudness figures cover the full length.
- Peak heights carry about ±1 dB of uncertainty (it depends on how a component lines up with the analysis grid). The “strongest component” comparison uses the energy within ±3 Hz instead of a single bin.
For listeners
Tracks labelled “528 Hz” are not all the same inside: some are a single pure tone, some stack octaves, some add noise or ambience. The three here differ from each other, too. To hear the pitches themselves, try the Frequency Lab; to find your own hearing ceiling, the Hearing Age Test. Where the number 528 comes from is covered in What is 528 Hz?.
This article does not guarantee any medical or health benefit and is not a substitute for professional medical care. If you have any health concerns, please consult a physician or other qualified professional.