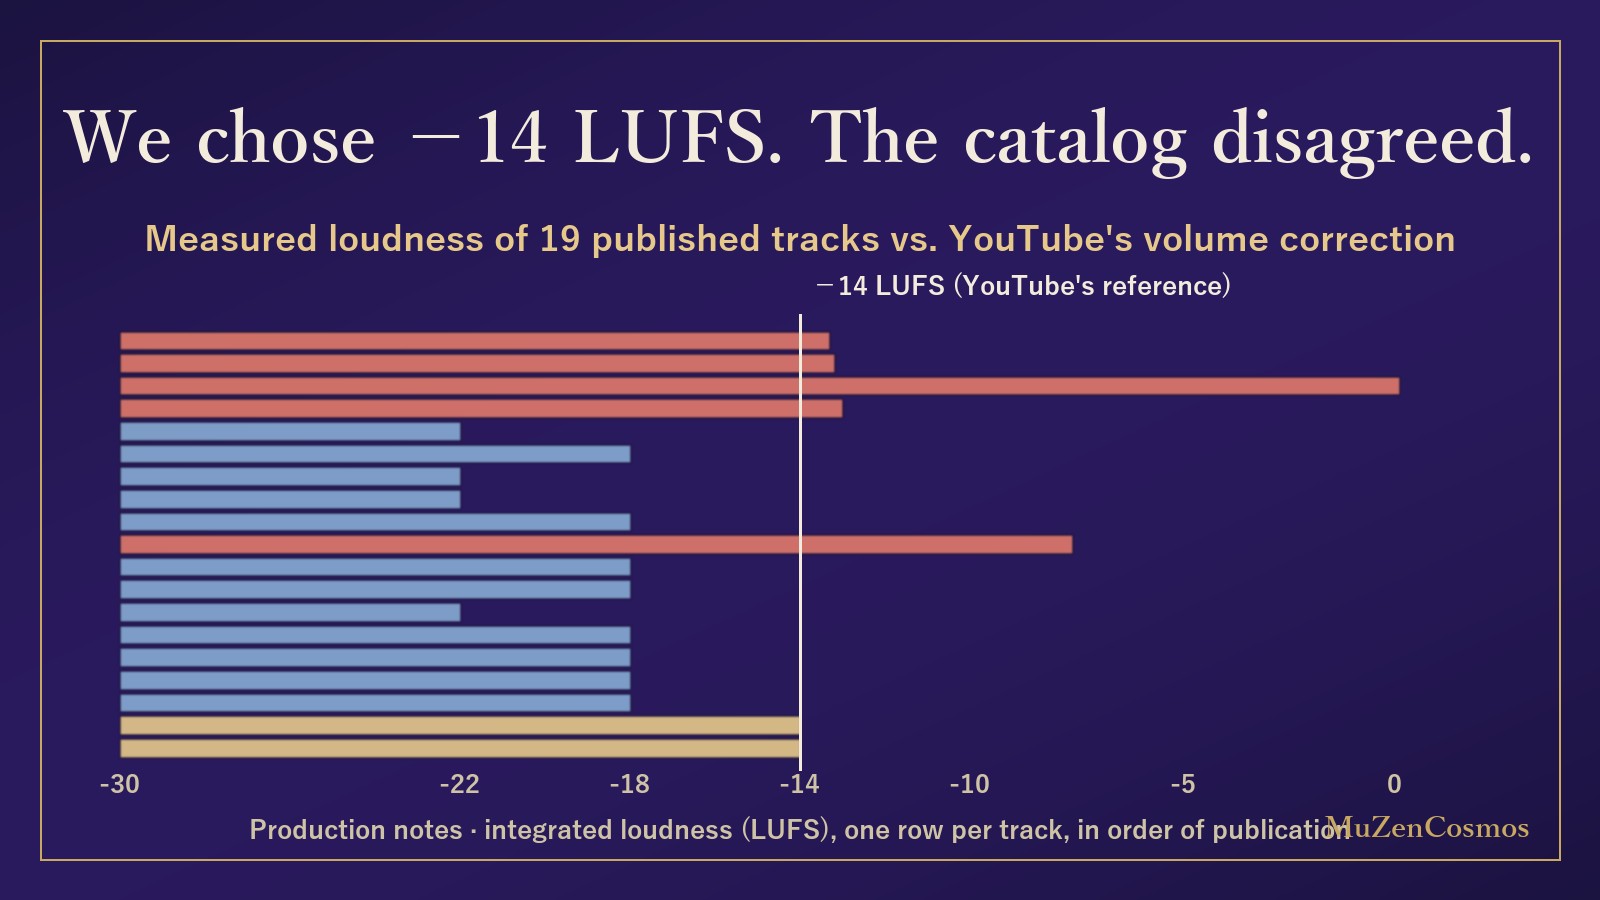
Since July 2026, the standard on this channel is an integrated loudness of −14 LUFS with true peak at or below −1.5 dBTP; since July 25, newly made 8-hour sleep versions form a second tier at −16.5 LUFS and −2.0 dBTP. In the previous measurement, two of the three tracks were exactly −14.0. But what about everything published before that? For 19 published long-form tracks I compared the measured loudness of the master files with the volume correction YouTube actually applies.
What LUFS is
LUFS is a unit for perceived loudness, defined in the ITU recommendation ITU-R BS.1770. The signal passes through a filter shaped roughly like the ear’s sensitivity (K-weighting), near-silent parts are excluded (gating), and the rest is averaged into one “integrated loudness.” 0 LUFS is the digital ceiling; smaller numbers are quieter. Broadcasters use EBU R 128, which sets −23 LUFS. It is a different scale from peak level (dBFS): two tracks with the same peak can differ widely in loudness if one sounds continuously.
The numbers in YouTube’s “Stats for nerds”
Right-click a YouTube video and choose “Stats for nerds.” The “Volume / Normalized” row shows two values, cont. and tgt.. On October 9, 2026, on my own videos, tgt. read −14.0 dB on every video, while cont. varied per video. I could not find an explanation of this display in YouTube’s help pages, so below I check it against my own measurements.
Method
- Master files (the WAVs before upload) measured over their full length with ffmpeg’s ebur128: integrated loudness and true peak.
- For the 19 published videos, the
cont.value and the Normalized percentage read from YouTube’s Stats for nerds on October 9, 2026. - The two matched track by track. Of the 23 videos read, 4 were excluded because the master still on disk is not the version that was uploaded (the values do not match), so no comparison was possible.
| Track (published) | Master, LUFS | True peak, dBTP | YouTube cont. | Plays at |
|---|---|---|---|---|
| 417 Hz 1 h (May 23) | -13.3 | -4.0 | -13.3 | 92% |
| 528 Hz Morning 1 h (May 24) | -13.2 | -1.5 | -13.2 | 91% |
| 174+396+432 Triple 6 h (May 29) | 0.1 | 0.1 | -0.4 | 21% |
| 741 Hz 1 h (May 30) | -13.0 | -1.6 | -13.0 | 89% |
| 396 Hz 8 h (May 31) | -22.0 | -10.6 | -22.0 | 100% |
| 432 Hz Focus 20 min (Jun 2) | -18.0 | -16.2 | -18.0 | 100% |
| 174 Hz Cedars 8 h (Jun 3) | -22.0 | -12.7 | -22.0 | 100% |
| 432 Hz Fireflies 8 h (Jun 4) | -22.0 | -15.6 | -22.0 | 100% |
| 528 Hz Focus 20 min (Jun 4) | -18.0 | -14.3 | -18.0 | 100% |
| 528·639·741 Solstice 1 h (Jun 6) | -7.6 | -2.0 | -7.6 | 48% |
| 396 Hz Focus 20 min (Jun 6) | -18.0 | -14.2 | -18.0 | 100% |
| 639 Hz Focus 20 min (Jun 8) | -18.0 | -14.4 | -18.0 | 100% |
| 528 Hz Pure 3 h (Jun 9) | -22.0 | -19.6 | -22.0 | 100% |
| 174 Hz Focus 20 min (Jun 10) | -18.0 | -13.9 | -18.0 | 100% |
| 741 Hz Focus 20 min (Jun 12) | -18.0 | -14.5 | -18.0 | 100% |
| 852 Hz Focus 20 min (Jun 15) | -18.0 | -14.7 | -18.0 | 100% |
| 417 Hz Focus 20 min (Jun 17) | -18.0 | -14.2 | -18.0 | 100% |
| 528 Hz Deep Sleep 8 h (Aug 6) | -14.0 | -7.5 | -14.0 | 100% |
| Autumn Insects 528 Hz 1 h (Sep 12) | -14.0 | -6.2 | -14.0 | 100% |
Finding 1: YouTube’s number is the integrated loudness itself
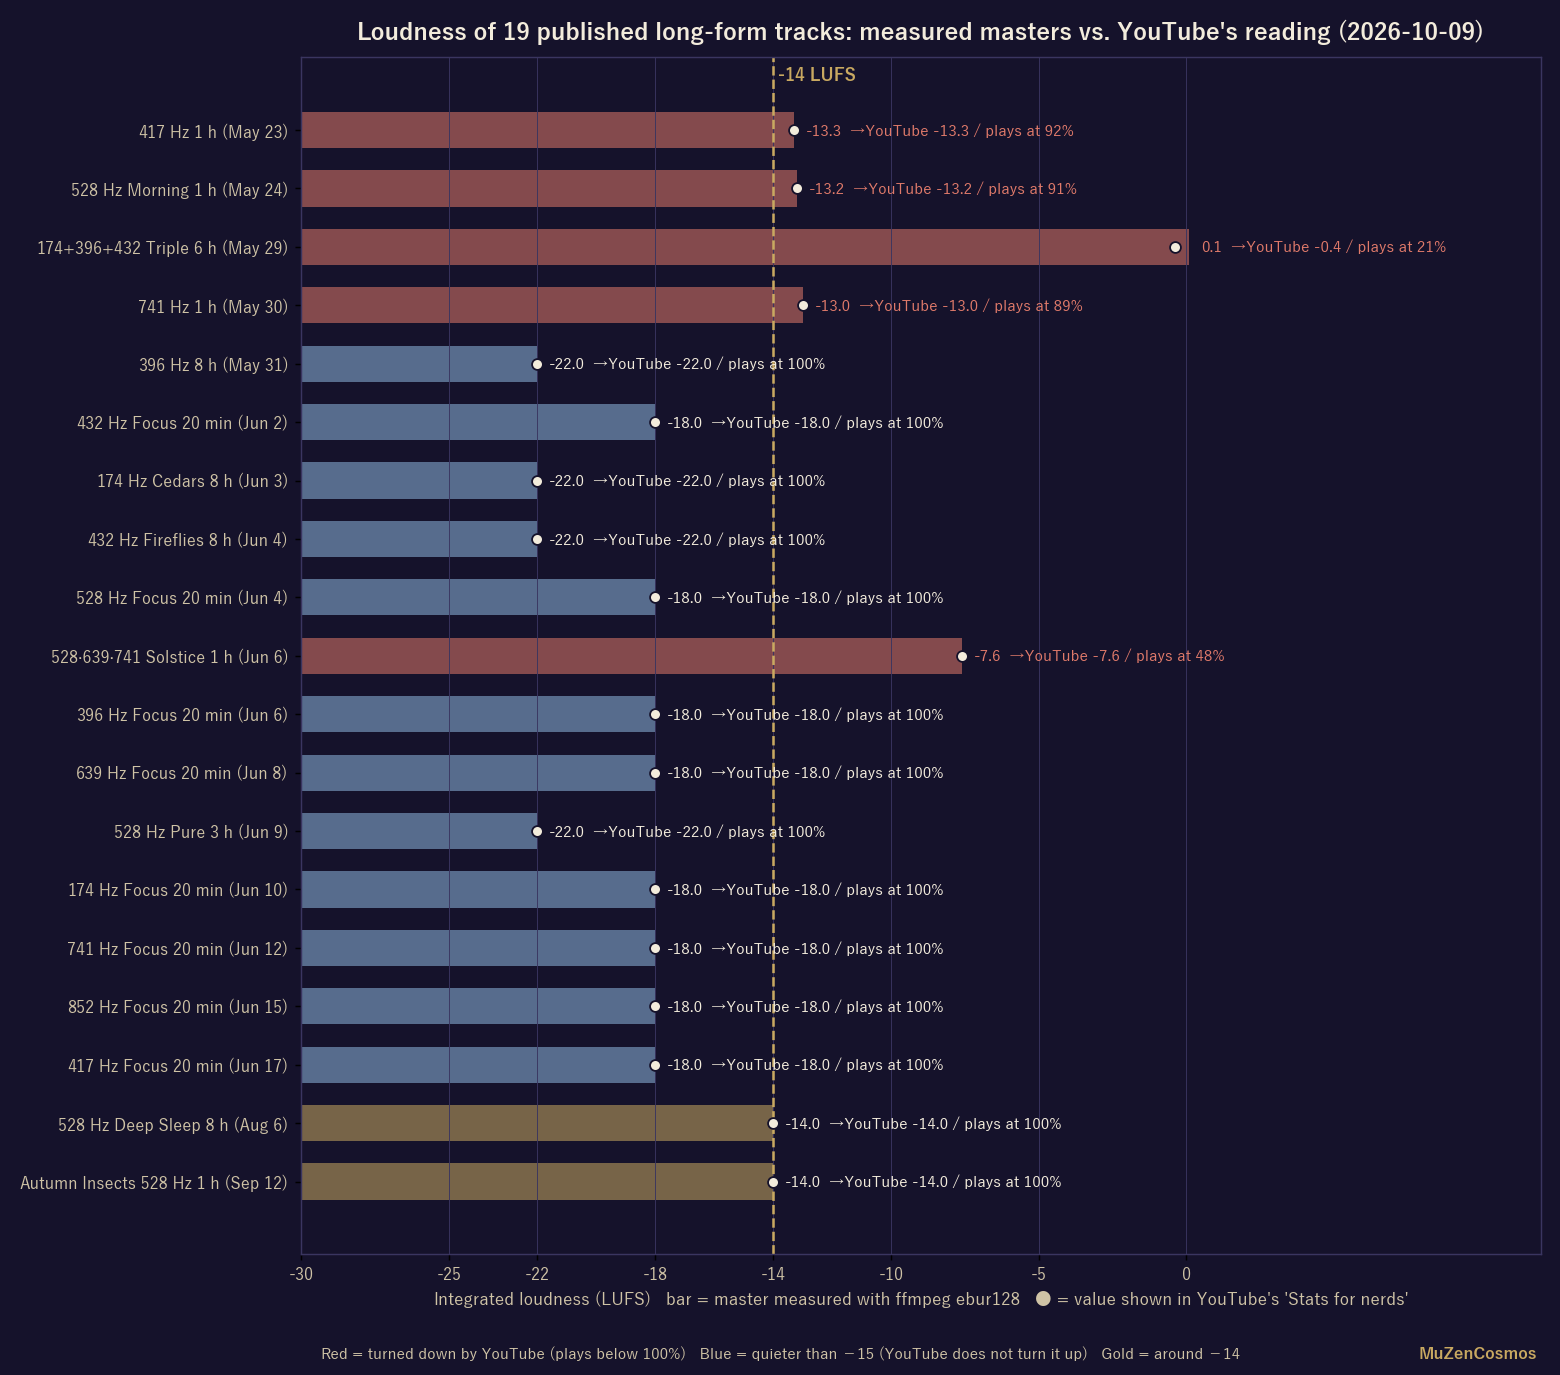
Across all 19 tracks, cont. and ffmpeg’s integrated loudness differed by at most 0.5 dB. So what YouTube measures appears to be BS.1770 integrated loudness. Only videos louder than the −14.0 tgt. had their playback reduced. Every one of the 12 videos quieter than −14 plays at 100%: YouTube does not turn quiet videos up.
Finding 2: the catalog was not at −14
The 19 tracks split into four levels: 4 around −22 LUFS (the 8-hour sleep tracks and the 3-hour Pure), 8 around −18 (the 20-minute focus tracks), 3 around −13 (the 1-hour tracks from May), and 2 around −14 (July onward). The reason is plain: the production recipes of the time said “−22 is fine for sleep” and “−18 for meditation.” The idea was that quiet uses deserve quiet masters.
But YouTube does not raise quiet videos. An 8-hour sleep track finished at −22 reaches the listener 8 dB quieter than a −14 track. Someone who turns the volume up to compensate then gets blasted by whatever autoplays next. Instead of picking a quietness track by track, the reference had to be set knowing that nothing gets turned up. That is why −14 became the standard in July; it is not about being louder. At the same time, 8-hour sleep versions are deliberately finished at −16.5, because that is a genre where the listener sets the volume once before sleep. They arrive 2.5 dB quieter, and we accept that knowingly. If listeners say the sleep tracks are too quiet, this two-tier rule will be reviewed.
Finding 3: one track was published clipped
The master of 174+396+432 Triple 6 h (May 29) measures +0.1 LUFS with a peak of +0.1 dBTP. It sits against the digital ceiling; in sampled segments, 5–7% of samples exceed full scale (clipping). YouTube plays this video at 21%, so the perceived volume is normal, but the distortion stays. This is the most-viewed long-form video on the channel. Going back through the records: the export step logged “corrected −16.5 → −14.0 LUFS,” and immediately afterwards the check step logged “FAIL (no measurement).” A ledger reconciliation in September then re-measured it at −0.35 LUFS. The anomaly was on record three times, and publication never stopped. The process now halts on a failed check. This track will be rebuilt and re-uploaded as a new version, and the next article will document that repair.
The other videos YouTube turns down were 528·639·741 Solstice 1 h (Jun 6) = -7.6 LUFS (plays at 48%), 741 Hz 1 h (May 30) = -13.0 LUFS (plays at 89%), 528 Hz Morning 1 h (May 24) = -13.2 LUFS (plays at 91%), 417 Hz 1 h (May 23) = -13.3 LUFS (plays at 92%).
For listeners: how to check for yourself
- Right-click the YouTube player and choose “Stats for nerds.”
- Look at the “Volume / Normalized” row. If the second percentage is below 100, YouTube is turning that video down.
- Inside the parentheses,
cont.is the video’s loudness andtgt.is YouTube’s reference (−14.0 at the time of this article).
This display is not officially documented and may change. The numbers in this article are as of October 9, 2026.
What this measurement does not tell
- YouTube’s official reference value. I found no number in the help pages; −14.0 is what the screen showed.
- Whether the same correction applies in the mobile apps or on TVs. This was a desktop browser only.
- Shorts were not measured.
To check the pitches themselves, see the Frequency Lab. The hearing-ceiling story is in My Ears Top Out at 13,000 Hz.
This article does not guarantee any medical or health benefit and is not a substitute for professional medical care. If you have any health concerns, please consult a physician or other qualified professional.